Invest Well,
All On Your Own
Industry-leading investment research with a long-term focus
Proprietary ratings tailored to quality, value, and income investors
Real investments based on our own research and ratings
Our Coverage
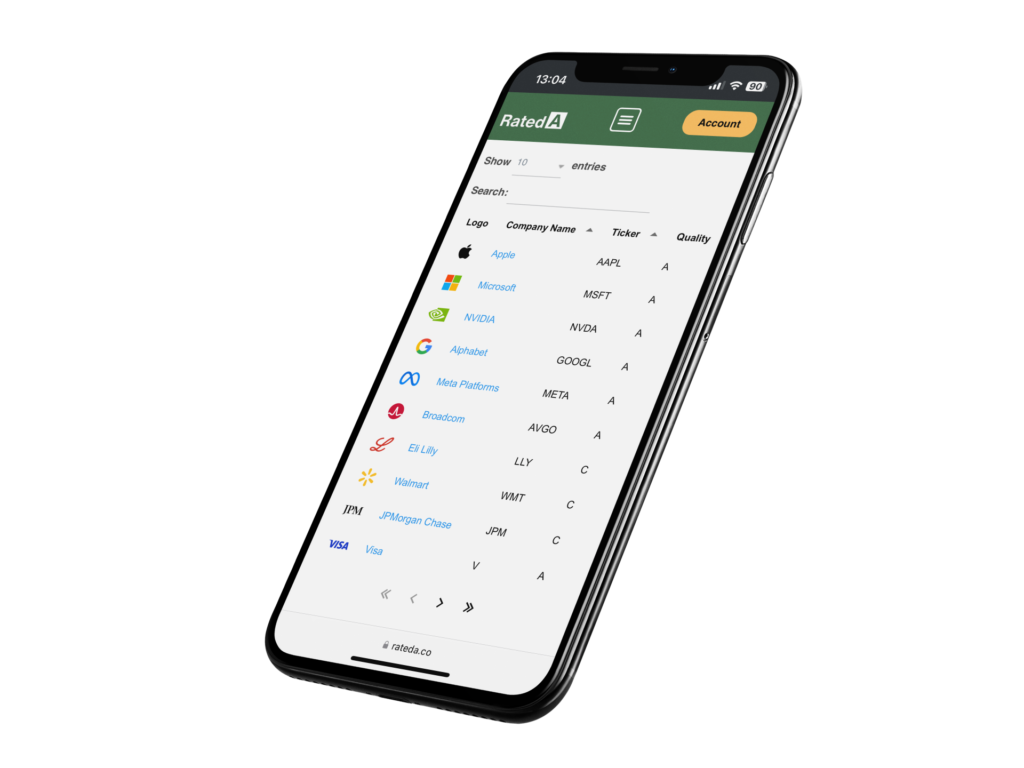
Logo | Company Name | Ticker | Value Rating | Income Rating | Market Cap (B. USD) | Price | Day Change % | Market Cap (B) | Dividend Yield % | Multiple | Quality Rating | Moat | Profitability | Safety | Industry | Country | Currency | Unique ID |
---|---|---|---|---|---|---|---|---|---|---|---|---|---|---|---|---|---|---|
British American Tobacco | LON:BATS | 4.25 | 4.13 | 82.46 | 29.75 | -1.16 | 64.92 | 7.92 | 6.47 | B* | 4 | 3 | 3 | Tobacco | United Kingdom | GBX | 1 | |
Altria | MO | 3.41 | 3.43 | 96.25 | 57.65 | 0.10 | 96.25 | 7.08 | 11.26 | D* | 3 | 2 | 1 | Tobacco | United States | USD | 2 | |
Philip Morris | PM | 3.10 | 3.45 | 201.41 | 131.82 | -0.35 | 201.41 | 4.10 | 25.95 | B* | 4 | 3 | 3 | Tobacco | United States | USD | 3 | |
T. Rowe Price | TROW | 2.31 | 3.13 | 26.62 | 124.16 | 0.17 | 26.62 | 3.99 | 42.96 | C* | 3 | 2 | 3 | Asset Management | United States | USD | 4 | |
LVMH | EPA:MC | 3.59 | 3.46 | 373.55 | 586.50 | -0.61 | 294.12 | 2.22 | 26.85 | A* | 5 | 4 | 5 | Luxury | France | EUR | 5 | |
Hershey | HSY | 3.20 | 3.20 | 35.54 | 174.09 | 0.46 | 35.54 | 3.15 | 23.65 | B* | 3 | 3 | 4 | Food & Beverages | United States | USD | 6 | |
Kering | EPA:KER | 3.30 | 3.47 | 34.12 | 219.80 | -0.88 | 26.86 | 6.37 | 14.75 | C* | 2 | 2 | 3 | Luxury | France | EUR | 7 | |
Walgreens Boots Alliance | WBA | 0.62 | 3.05 | 7.77 | 9.06 | 3.78 | 7.77 | 11.04 | 0.00 | F | 0 | 0 | 0 | Retail | United States | USD | 8 | |
MSCI | MSCI | 3.08 | 2.91 | 46.44 | 604.96 | 0.50 | 46.44 | 1.06 | 44.45 | A* | 5 | 5 | 4 | Financial Services | United States | USD | 9 | |
Nike | NKE | 3.49 | 2.96 | 116.29 | 78.34 | 0.94 | 116.29 | 2.04 | 20.45 | B | 4 | 3 | 4 | Apparel | United States | USD | 10 | |
Starbucks | SBUX | 2.15 | 2.37 | 116.21 | 101.51 | 0.82 | 116.21 | 2.40 | 38.31 | D | 2 | 2 | 2 | Restaurants | United States | USD | 11 | |
Visa | V | 3.66 | 2.86 | 612.97 | 314.70 | 0.92 | 612.97 | 0.75 | 28.58 | A | 5 | 5 | 5 | Financial Services | United States | USD | 12 | |
Broadcom | AVGO | 3.11 | 3.07 | 743.44 | 159.67 | -3.08 | 743.44 | 1.33 | 42.81 | A* | 5 | 5 | 4 | Semiconductors | United States | USD | 13 | |
Microsoft | MSFT | 3.11 | 2.88 | 3,064.12 | 422.99 | -1.17 | 3,064.12 | 0.78 | 49.65 | A | 5 | 5 | 5 | Software | United States | USD | 14 | |
Mastercard | MA | 3.20 | 2.67 | 481.59 | 532.38 | 0.74 | 481.59 | 0.50 | 45.08 | A* | 5 | 5 | 5 | Financial Services | United States | USD | 15 | |
Oracle | ORCL | 2.37 | 2.37 | 511.38 | 182.70 | -4.03 | 511.38 | 0.88 | 64.11 | B* | 5 | 3 | 3 | Software | United States | USD | 16 | |
Charles Schwab | SCHW | 2.86 | 2.42 | 149.38 | 82.60 | 0.43 | 149.38 | 1.21 | 32.39 | B* | 4 | 3 | 3 | Banks | United States | USD | 17 | |
Salesforce | CRM | 2.88 | 2.37 | 314.42 | 330.01 | -3.84 | 314.42 | 0.48 | 47.90 | A* | 5 | 4 | 4 | Software | United States | USD | 18 | |
Alphabet | GOOGL | 3.06 | 2.50 | 2,028.16 | 169.23 | 0.07 | 2,028.16 | 0.47 | 45.49 | A* | 5 | 5 | 4 | Software | United States | USD | 19 | |
HP | HPQ | 3.12 | 2.38 | 32.57 | 34.66 | -11.36 | 32.57 | 3.35 | 11.59 | D* | 1 | 0 | 3 | Consumer Electronics | United States | USD | 20 | |
Lindt & Sprüngli | SWX:LISN | 2.33 | 2.39 | 26.09 | 98,800.00 | -1.20 | 22.98 | 1.42 | 48.89 | C* | 3 | 1 | 5 | Food & Beverages | Switzerland | CHF | 21 | |
Apple | AAPL | 3.12 | 2.32 | 3,472.75 | 234.93 | -0.06 | 3,472.75 | 0.43 | 37.11 | A | 5 | 4 | 4 | Consumer Electronics | United States | USD | 22 | |
Yum! Brands | YUM | 2.34 | 2.11 | 37.94 | 139.33 | 0.50 | 37.94 | 1.74 | 32.03 | D* | 1 | 3 | 2 | Restaurants | United States | USD | 23 | |
Domino's Pizza | DPZ | 2.33 | 2.03 | 15.64 | 472.34 | -0.12 | 15.64 | 1.28 | 36.79 | C* | 2 | 4 | 2 | Restaurants | United States | USD | 24 | |
Meta Platforms | META | 2.59 | 1.96 | 1,400.86 | 569.20 | -0.76 | 1,400.86 | 0.35 | 49.11 | B* | 4 | 4 | 3 | Software | United States | USD | 25 | |
NVIDIA | NVDA | 1.91 | 1.63 | 3,476.36 | 135.34 | -1.15 | 3,476.36 | 0.03 | 142.46 | B* | 4 | 4 | 3 | Semiconductors | United States | USD | 26 | |
Automatic Data Processing | ADP | 3.34 | 3.38 | 123.91 | 306.92 | -0.34 | 123.91 | 2.01 | 34.03 | A | 5 | 4 | 5 | Professional Services | United States | USD | 27 | |
Paychex | PAYX | 3.43 | 3.63 | 51.99 | 145.71 | -0.33 | 51.99 | 2.69 | 31.34 | A* | 4 | 5 | 5 | Professional Services | United States | USD | 28 | |
Eli Lilly | LLY | 1.08 | 1.78 | 709.08 | 788.19 | -0.14 | 709.08 | 0.66 | 4,378.83 | C* | 3 | 3 | 2 | Pharmaceuticals | United States | USD | 29 | |
Pfizer | PFE | 2.28 | 3.34 | 145.70 | 25.83 | 0.23 | 145.70 | 6.50 | 33.99 | D* | 3 | 1 | 2 | Pharmaceuticals | United States | USD | 30 | |
Toronto Dominion Bank | TSE:TD | 3.34 | 3.24 | 98.94 | 79.39 | 0.39 | 138.51 | 5.14 | 14.15 | C* | 3 | 2 | 2 | Banks | Canada | CAD | 31 | |
Royal Bank of Canada | TSE:RY | 3.17 | 2.78 | 177.55 | 175.80 | 0.02 | 248.54 | 3.23 | 16.73 | C* | 3 | 2 | 2 | Banks | Canada | CAD | 32 | |
Nasdaq | NDAQ | 3.09 | 2.54 | 46.60 | 83.05 | 0.48 | 46.60 | 1.16 | 29.66 | B* | 5 | 3 | 3 | Exchanges | United States | USD | 33 | |
Euronext | EPA:ENX | 3.86 | 3.07 | 14.29 | 106.10 | -0.38 | 11.25 | 2.34 | 14.46 | B* | 5 | 2 | 3 | Exchanges | Netherlands | EUR | 34 |
Different ratings for different investing strategies.
Quality Ratings
Our Quality Ratings predict which companies will likely generate superior long-term economic returns.
Value Ratings
Our Value Ratings predict which stocks might be timely investments, based on quality and current price.
Income Ratings
Our Income Ratings indicate which stocks present the optimal dividend yield, growth, and safety combination.